
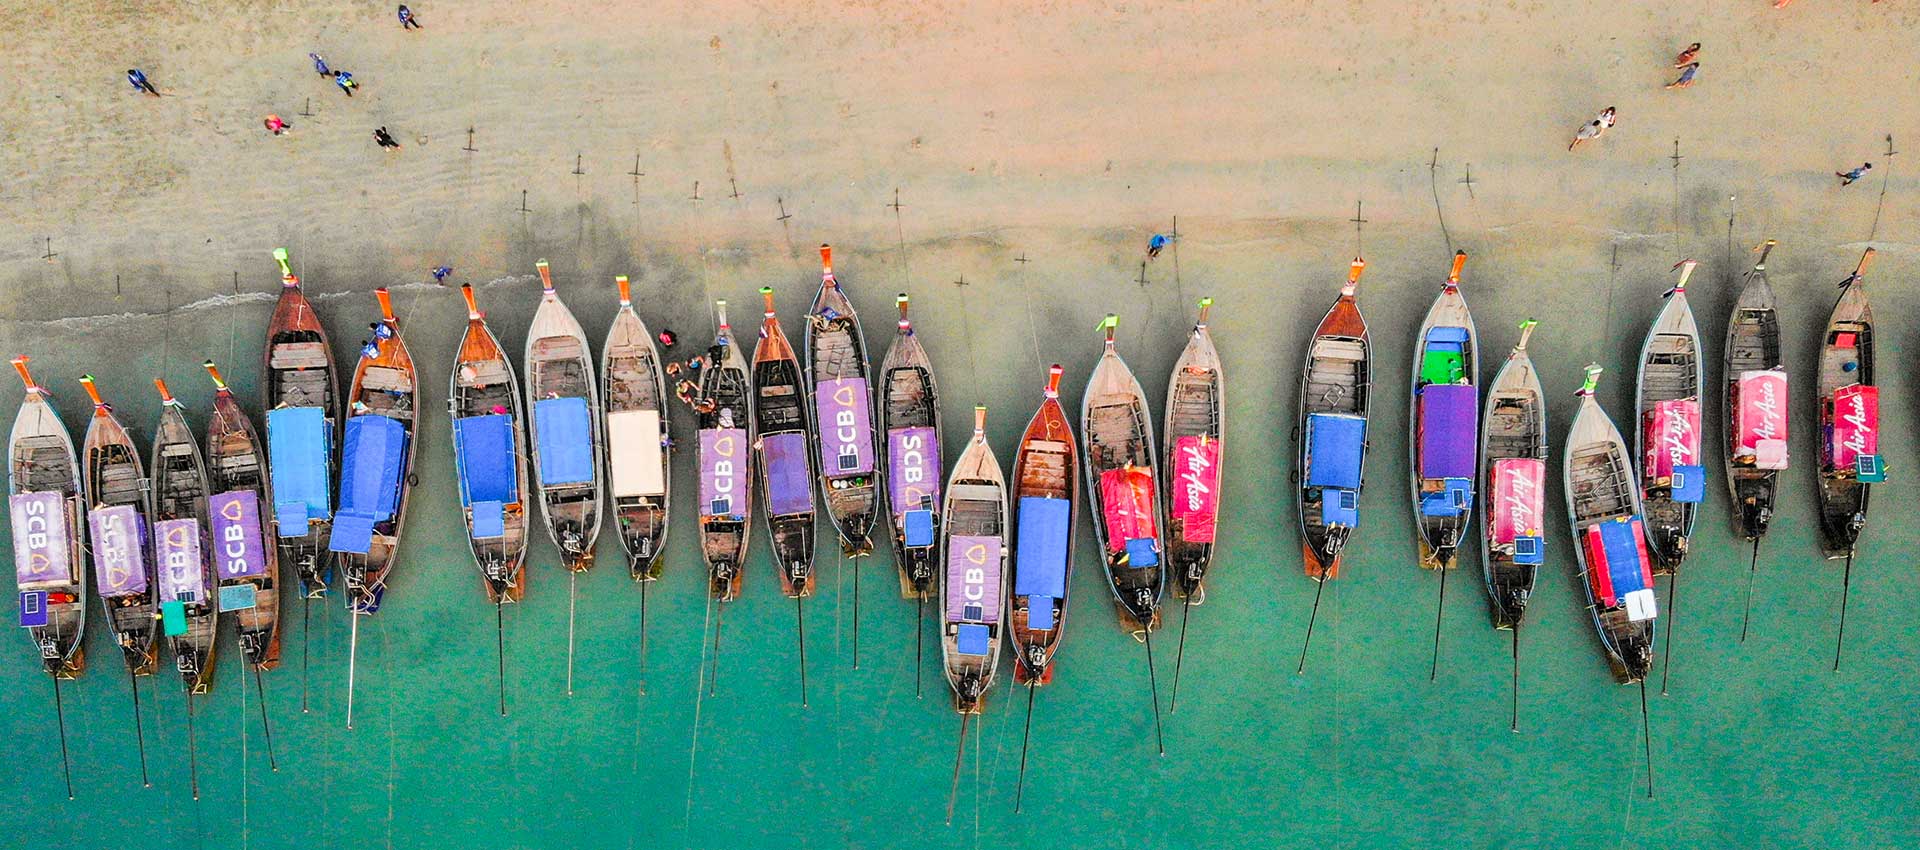
Phuket, Destination and Territorial Profile
Chapter 4: Destination and Territorial Profile
Phuket Province represents a highly dynamic, bounded island ecosystem operating as one of Southeast Asia’s premier international tourism gateways. Understanding its baseline geography, demographic pressures, and economic structure is essential for evaluating its carrying capacity and environmental vulnerability.
4.1 Geography, Topography, and Administrative Boundaries
Phuket is Thailand’s largest island, situated in the Andaman Sea off the southwestern coast of the Malay Peninsula. Located between latitudes 7°45’N and 8°15’N, the province covers a total land area of approximately 547.3 km², which includes the main island of Phuket (517.5 km²) and 32 smaller satellite islands (such as Ko Racha Yai, Ko Racha Noi, Ko Hae, and Ko Naka Yai).
The topography is predominantly mountainous, with a north-south mountain range covering approximately 70% of the land area. The remaining 30% consists of central and coastal plains. The highest peak, Khao Mai Thao Sip Song, rises to 529 metres above sea level. This rugged interior topography concentrates human settlement, agricultural activity, and tourism infrastructure along the narrow coastal fringes and central lowlands.
Administrative Structure
Phuket Province (Changwat Phuket) is administratively divided into 3 Districts (Amphoe), which are further subdivided into 17 Sub-districts (Tambon) and 103 Villages (Muban):
- Thalang District (North): Covers 252.0 km²; characteristically lower density, housing Phuket International Airport, Sirinat National Park, agricultural land, and high-end resort enclaves (e.g., Laguna Phuket).
- Kathu District (West/Central): Covers 67.1 km²; contains the primary mass tourism hub of Patong Municipality, alongside Kathu Town and major commercial/golf corridors.
- Mueang Phuket District (South): Covers 224.2 km²; functions as the administrative, cultural, and commercial heart of the province, including Phuket City Municipality and major port hubs (Chalong, Rassada).
4.2 Demographic Profile and Population Dynamics
Evaluating resource consumption in Phuket requires distinguishing between the official registered population and the total functional population operating on the island at any given time.
| Population Segment | Estimated Volume | Data Source / Basis | Resource Impact Implication |
|---|---|---|---|
| Registered Residents | 425,124 | NSO Thailand / Civil Registration (2024) | Baseline municipal service demand year-round. |
| Unregistered Domestic Workers | ~150,000–200,000 | Provincial Labour Office estimates | Thai nationals registered in other provinces working in hospitality/services. |
| Migrant Labour Force | ~70,000–100,000 | Ministry of Labour (Myanmar, Cambodia, Lao PDR) | Primary workforce in construction, agriculture, fishing, and back-of-house hospitality. |
| Expatriate / Long-Stay Residents | ~35,000–50,000 | Immigration Bureau long-term visa records | Retirees, digital nomads, business owners; high per capita resource footprint. |
| Total Baseline Functional Population | ~680,000–775,000 | Cumulative Territorial Estimate | Excludes transient tourists; represents true island baseline pressure. |
4.3 Structure and Evolution of the Visitor Economy
Phuket’s economic history over the past century exhibits a radical structural shift from primary extraction to tertiary tourism mono-culture:
- Tin Mining Era (19th Century – 1970s): Phuket was a major center for tin dredging, leaving behind extensive altered landscapes, inland mining pits (kbuang), and coastal sediment deposits.
- Agricultural Transition (1950s – Present): Expansion of rubber plantations, coconut groves, and oil palm production across central and northern lowlands.
- International Tourism Boom (1980s – Present): Rapid commercial transformation following the construction of Phuket International Airport and early resort development along Patong, Karon, and Kata beaches.
Today, tourism directly and indirectly accounts for over 75% of Gross Provincial Product (GPP). The province generates approximately 240–260 billion THB annually in economic value, making it one of Thailand’s highest per capita income provinces, but also one of its most vulnerable to external macro-shocks.
Market Characteristics and Seasonality
The visitor profile is shaped by the monsoon cycle. The Southwest Monsoon (May–October) brings heavy rainfall and rough sea conditions to western beaches, marking the low tourist season. The Northeast Monsoon (November–April) brings dry, calm conditions, marking the peak visitor window.
| Tourism Indicator | Pre-Pandemic Baseline (2019) | Post-Recovery Baseline (2024 Est.) |
|---|---|---|
| Total Visitor Arrivals | 14.5 Million | 11.3 Million |
| International vs. Domestic Split | 72% International / 28% Domestic | 68% International / 32% Domestic |
| Top Source Markets | China, Russia, Australia, India, Germany | Russia, China, India, Australia, UK |
| Average Length of Stay | 4.5 Days (Overall) / 9.2 Days (Long-haul) | 5.1 Days (Overall) / 10.8 Days (Long-haul) |
| Licensed Accommodation Stock | ~90,000 rooms | >100,000 rooms (Inc. registered units) |
4.4 Spatial Distribution of Infrastructure and Concentration
A central vulnerability of Phuket’s territorial model is extreme spatial concentration. Tourism infrastructure, commercial real estate, and municipal consumption are heavily skewed toward the western coastal corridor:
- West Coast Corridor (Patong, Karon, Kata, Kamala, Bang Tao): Concentrates over 80% of total hotel room capacity, commercial entertainment zones, and beachfront water/waste demands.
- East Coast Corridor (Phuket Town, Rassada, Chalong): Functions as the logistical, administrative, and maritime transportation nexus, hosting primary ports for tourist departures to Phang Nga Bay and Phi Phi Islands.
- Northern Interior (Thalang, Mai Khao, Nai Yang): Retains critical natural capital, forest reserves, agricultural land, and airport infrastructure, but faces increasing pressure from residential real estate and luxury villa development.
This high spatial imbalance creates localized environmental bottlenecks, severe coastal water quality degradation along west coast bays, and intense daily traffic congestion along north-south transit corridors (Highway 402).